
Figure 1.
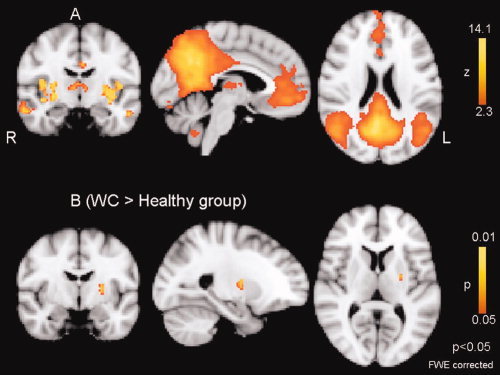
Default‐mode network (DMN). A: Spatial map representing DMN for the entire 32 participants (WC = 16 and controls = 16). B: Difference in network connectivity between the healthy group and WC calculated using the dual‐regression approach. There is a significantly increased connectivity in the left putamen in WC.