
Figure 2.
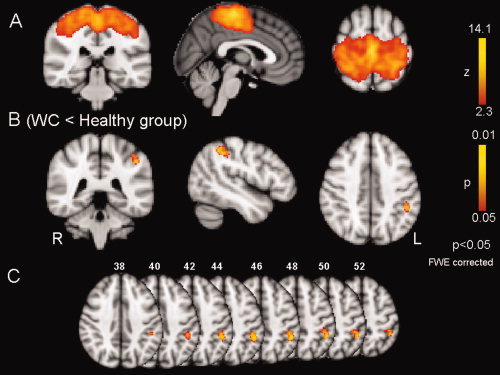
Sensorimotor network (SMN). A: Spatial map representing the SMN for the entire 32 participants (WC = 16 and controls = 16). B: Difference in SMN between healthy subjects and WC calculated using the dual‐regression approach. There is significantly decreased connectivity in left primary somatosensory cortex in WC. C: Axial slices of 2B, the coordinate of each slice is expressed in mm. It also shows areas involving anterior intraparietal sulcus (aIPS) and partially the inferior parietal lobule (IPL).