
Figure 1.
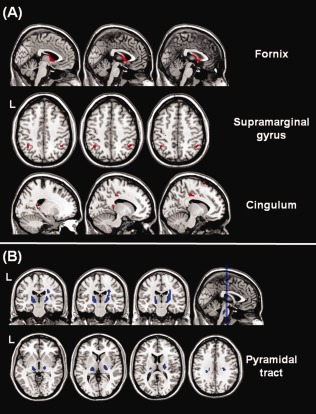
Voxel‐wise comparison of ACM values between patients with AD and HS. Reductions of structural connectivity in patients are shown in red (panel A), whereas increases are shown in blue (panel B). The reductions located in the fornix, in the supramarginal gyri and in the cingulum are consistent with a progressive disconnection between the medial temporal lobes and the rest of the brain. The increased ACM values in the cortico‐spinal tract might reflect a relative sparing of this WM tract compared to association bundles (i.e., the superior longitudinal fasciculus). See text for further details.