
Figure 1.
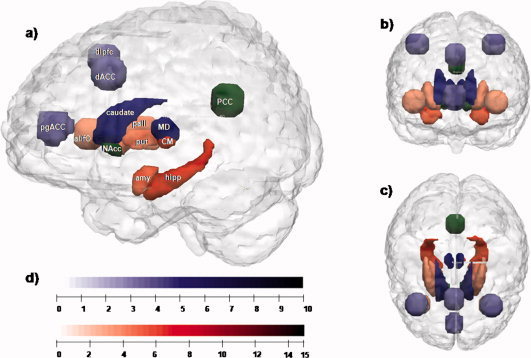
Network segregation based on relative fiber counts. (a) Sagittal plane; (b) coronal plane; (c) transversal plane (d) color bars: indicating the level of T‐values for each region shown in (a)–(c). Regions with preferential connectivity to the MD are shown in blue and those connecting stronger to the CM/Pf complex are shown in red, the strength of the connectivity are visualized in the brightness of the blue and red colors. The PCC and the nucleus accumbens do not show significant preferences and appear in green. Abbreviations: MD, mediodorsal thalamic nucleus; CM, centromedian/parafascicular complex of the thalamus; amy, left amygdala; hipp, left hippocampus; PCC, posterior cingulate cortex; put, right putamen; pall, right pallidum; NAcc, right nucleus accumbens; caudate, right caudate nucleus; dlPFC, right dorsolateral prefrontal cortex; dACC, dorsal anterior cingulate cortex; pgACC, pregenual anterior cingulate cortex; aI/fo, left anterior insula‐frontal operculum.