
Figure 2.
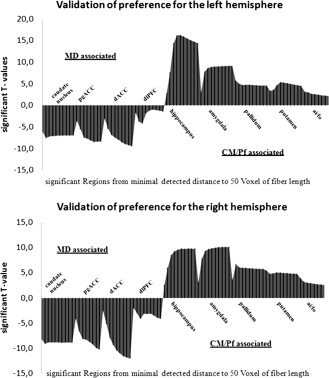
For the left and right hemispheres, the above histograms show significant T‐values (P <0.05) between seed regions and different target regions. Fibers were counted on steps of 5‐voxel‐path length differences, from minimal detected distance to 50 voxels. For each counting step, the CM‐associated regions are shown above T value = 0 and the MD corresponding regions are shown below T value = 0. T values are given for relative preferences significantly different from zero. Real anatomical distance was verified in the range of 10–19 voxels of path length between seeds and target regions. Even beyond anatomical distance, the fiber count revealed significant effects of constant relative preference.