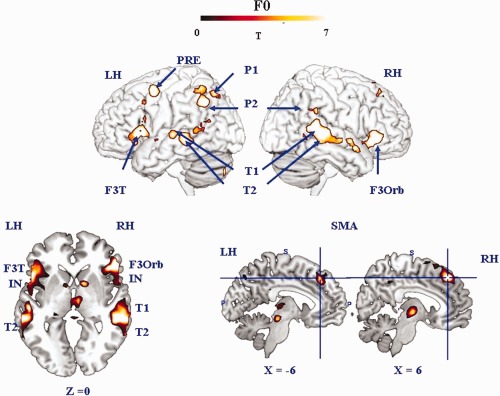
Figure 5.

Surface rendering of brain regions involved in the F0 parametric analysis (random‐effect group analyses, P < 0.05, FDR corrected, cluster extend threshold of 25 voxels, LH/RH: left/right hemisphere). Activated regions are indicated by blue arrows. LH, left hemisphere; RH, right hemispheres; F3Orb, inferior frontal gyrus, pars orbitalis; F3T, inferior frontal gyrus, pars triangularis; SMA, supplementary motor area; P2, inferior parietal gyrus; P1, superior parietal gyrus; T1, superior temporal gyrus; T2, middle temporal gyrus. [Color figure can be viewed in the online issue, which is available at http://wileyonlinelibrary.com.]
