
Figure 5.
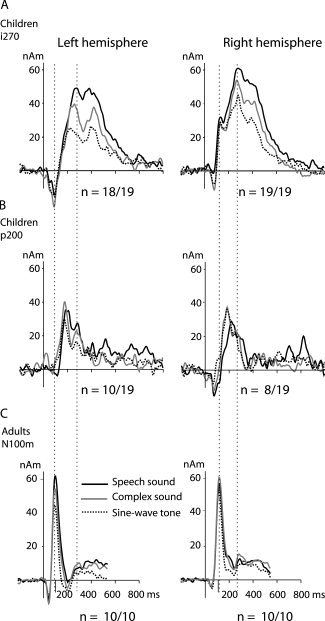
Mean time course of activation. The two upper rows show the amplitude (in nanoamperemeters, nAm) as a function of time in the i270 (A) and p200 (B) source areas in children, in the left and right hemisphere (left and right columns, respectively). For comparison, the mean time course of activation of the N100 sources in adults is plotted in (C). The responses to speech sounds, complex sounds, and sine‐wave tones are plotted with different line types. The first dashed vertical line indicates the latency of the maximum activation of the N100m source in adults and the second one that of the i270 source in children.