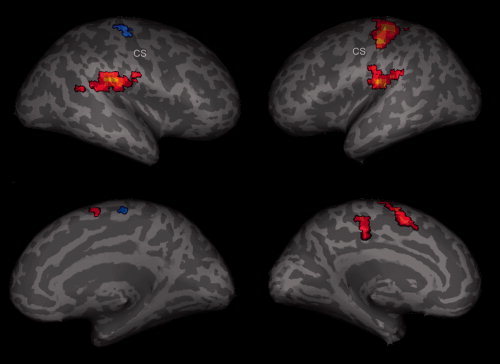
Figure 1.

Random effect group (n = 12) analysis. Activations (P < 0.003, FDR corrected) and deactivations (P < 0.001, uncorrected) in response to event‐related (2 s) right median nerve stimulation are shown superimposed on an inflated brain, showing views on the right and left hemisphere. Yellow‐red encode positive BOLD signals whereas blue encode negative BOLD signals.
