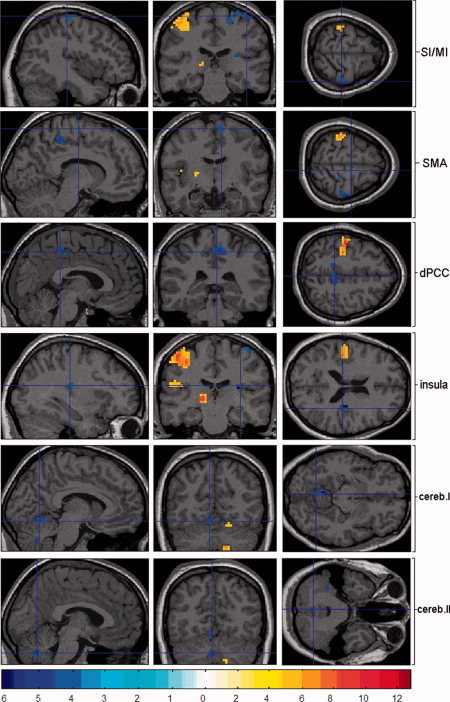
Figure 2.

Random effect group (n = 12) analysis. Activations (P < 0.05, FDR corrected) and deactivations (P < 0.001, uncorrected) in response to blocked (30 s) right median nerve stimulation are shown superimposed on an individual brain in sagittal (left), coronal (middle), and axial (right) orientation. To investigate the network of negative BOLD signal changes, we focused the images on the deactivated clusters. Red encodes positive BOLD signals whereas blue encodes negative BOLD signals. Because of the use of different MRI‐sequences with different numbers of voxels, we used a different threshold for the activation t‐map compared to the event‐related design. Therefore, we are able to maintain a static t‐value threshold in order to provide a comparable visual impression.
