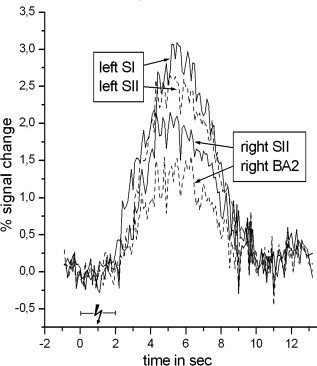
Figure 5.

Event‐related positive BOLD signal time course for the most activated cluster (highest t‐value) within left SI, left SII, right SII, and right Brodmann area 2 following median nerve stimulation. All data were averaged across 30 voxels surrounding the peak response. The time courses were extracted before spatial smoothing and were averaged across all subjects.
