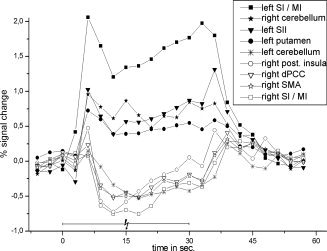
Figure 6.

Blocked positive and negative BOLD signal time course for the most activated clusters (highest t‐value) within left/right SI/MI, left SII, left putamen, left/right cerebellum, right posterior insula, right SMA, and right dPCC during median nerve stimulation. All data were averaged across 30 voxels surrounding the peak response. The time courses were extracted prior to spatial smoothing and averaged across all subjects. The cerebellar activation/deactivation consisted of two/three different clusters, which were averaged.
