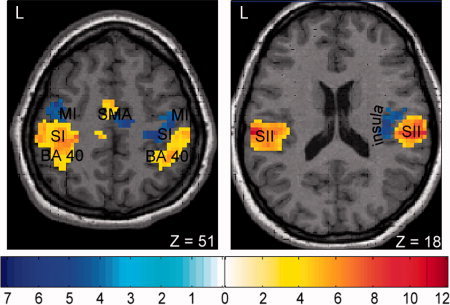
Figure 7.

Results from the ICA group analysis (n = 12) for the blocked median nerve stimulation. The two main IC's are shown superimposed on an individual brain in axial orientation. Red encodes the IC with a positive correlation to the stimulation paradigm (activations; P < 0.05, FDR corrected), whereas blue encodes the IC with a negative correlation (deactivations; P < 0.001, uncorrected).
