
Figure 3.
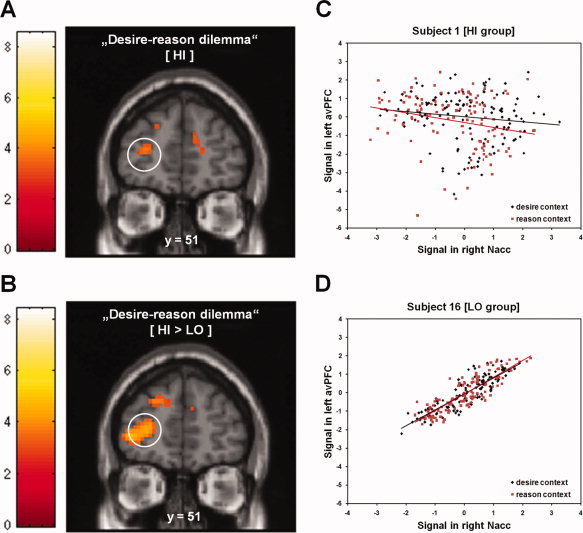
Context‐related changes in prefrontostriatal connectivity during the “desire‐reason dilemma.” (A) Reduced connectivity between right Nacc and left avPFC during the dilemma in the HI group (dilemma‐related reductions in prefrontostriatal connectivity are displayed on a coronal slice of the MNI template, color bars show associated t‐values; see also Table III). Importantly, on the group level this inverse functional connectivity was a result of a reduced positive coupling, rather than an increase in the negative functional connectivity between the two brain regions (see also Supporting Information, Table S2). (B) Reduced connectivity between right Nacc and left avPFC during the “desire‐reason dilemma,” which was more negative for HI compared with LO subjects. (C) PPI of the right Nacc for a representative single subject from the HI group. Mean‐corrected activity (in arbitrary units) in left avPFC (MNI coordinates (x y z): −24 48 9; box of 3 × 3 × 3 mm3) is displayed as a function of mean‐corrected activity in right Nacc (MNI coordinates (x y z): 15 12 −6; box of 3 × 3 × 3 mm3). Black diamonds represent measurements during bonus acquisition in the “desire context,” red squares denote measurements during rejection of immediate reward in the “reason context.” To take into account the hemodynamic lag in the BOLD response when assigning data points to conditions, the onset of conditions was delayed by 6 s (for a similar procedure please see Stephan et al. [2003]. (D) PPI of the right Nacc for a representative single subject from the LO group. Mean‐corrected activity (in arbitrary units) in left avPFC is displayed as a function of mean‐corrected activity in right Nacc. [Color figure can be viewed in the online issue, which is available at wileyonlinelibrary.com.]