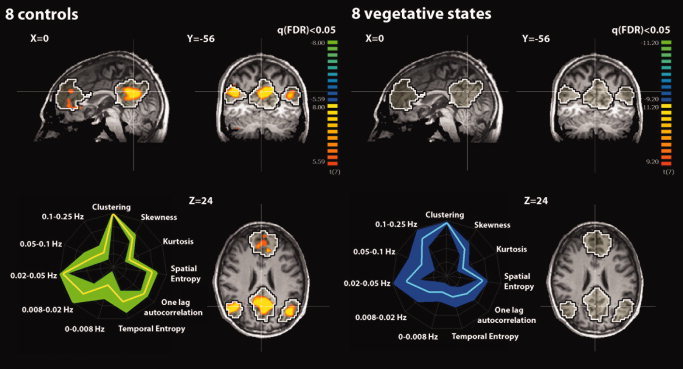
Figure 3.

Upper part: Random‐effect group analyses identifying the default‐mode network (DMN) in eight healthy controls and eight patients in a vegetative state (VS). Results are thresholded at false discovery rate corrected P < 0.05 with a mask given by the black and white contour regions showing the DMN from an independent dataset (n = 11 healthy controls, Group 1). Lower part: Graphical representation (i.e., fingerprint; normalized values) of DMN temporal properties (five frequency bands, temporal entropy, and one‐lag autocorrelation) and spatial properties (spatial entropy, skewness, kurtosis, and clustering) in healthy controls [mean (yellow) and SD (green)] and in VS patients [mean (cyan) and SD (blue)]. [Color figure can be viewed in the online issue, which is available at wileyonlinelibrary.com.]
