
Figure 5.
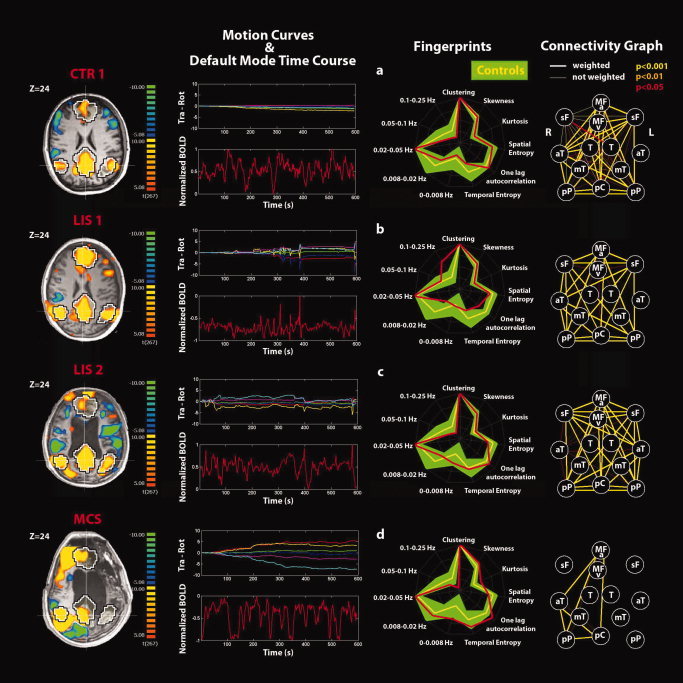
Single‐subject analyses identifying the default‐mode network (DMN) and connectivity graphs in (a) a representative healthy control, (b, c) LIS patients 1, 2, and (d) MCS patient. Positive correlations (yellow) and anticorrelations (blue) with the DM time course shown on a transverse section at Z = 24 mm (thresholded at corrected P < 0.05). Black and white contour regions show the DMN from an independent dataset of 11 healthy controls. Motion curves illustrate translation (in mm) for x (red), y (green), and z (blue) and rotation (in °) for pitch (yellow), roll (purple), and yaw (cyan) parameters, and the DMN time course illustrates the normalized BOLD signal over 600 s. The fingerprint summarizes the DMN temporal and spatial properties for each subject (red) superimposed to the control data of eight healthy subjects (mean in yellow and standard deviation in green). The connectivity graph illustrates the connections between the 13 selected DM nodes at different thresholds for significance (thick lines, “weighted edges” are corrected for external network anticorrelations). Nodes are defined as for Figure 1.