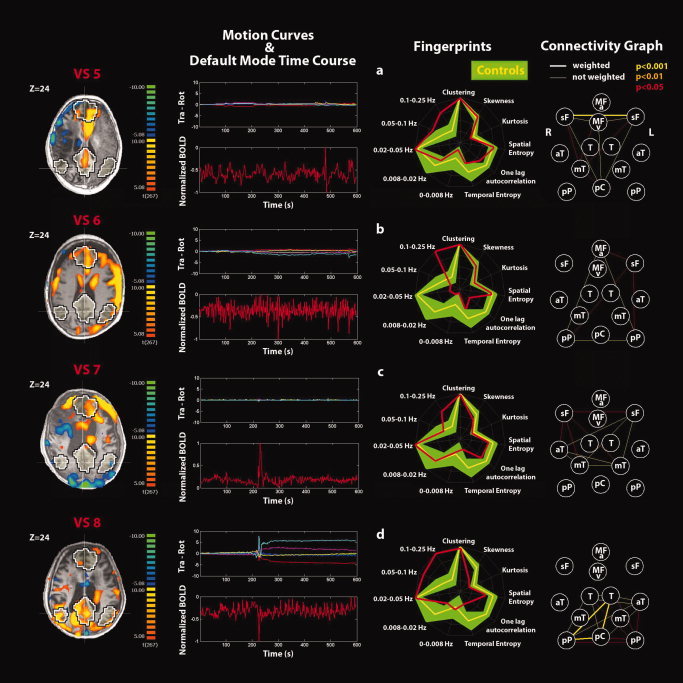
Figure 7.

Single‐subject analyses identifying the default‐mode network (DMN) and connectivity graphs in (a–d) VS patients 5–8. See Figure 5 for explanatory legend. [Color figure can be viewed in the online issue, which is available at wileyonlinelibrary.com.]
