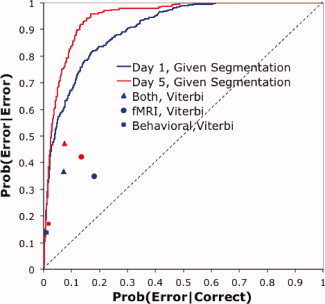
Figure 11.

The performance on error classification of steps using the segmentation inferred by the Viterbi Algorithm from the various information sources. Blue is Day 1 performance and red is Day 5 performance. The ROC curves assume correct segmentation and use both the linear discriminant analysis of the imaging data and the behavioral model of the behavioral data.
