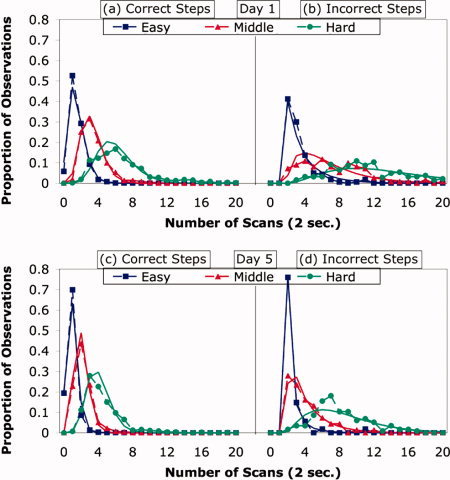
Figure 3.

(a,b): Distribution of step times for a student on Day 1 as function of the difficulty other students experienced with that step. (c,d): Distribution of step times for a student on Day 5 as function of the difficulty other students experienced with that step and how slow that student was on Day 1. The points connected by dotted lines are the actual proportions of observations with different number of scans. The smooth lines are fitted gamma functions. [Color figure can be viewed in the online issue, which is available at wileyonlinelibrary.com.]
