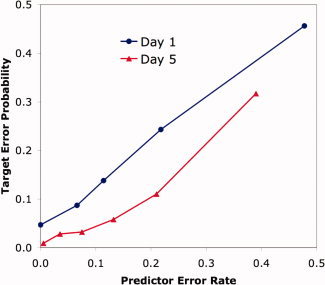
Figure 4.

Probability that a student will make an error on a step as a function of the predictor error estimated from other data. Similar predictor error rates are aggregated to give different points on the figure. [Color figure can be viewed in the online issue, which is available at wileyonlinelibrary.com.]
