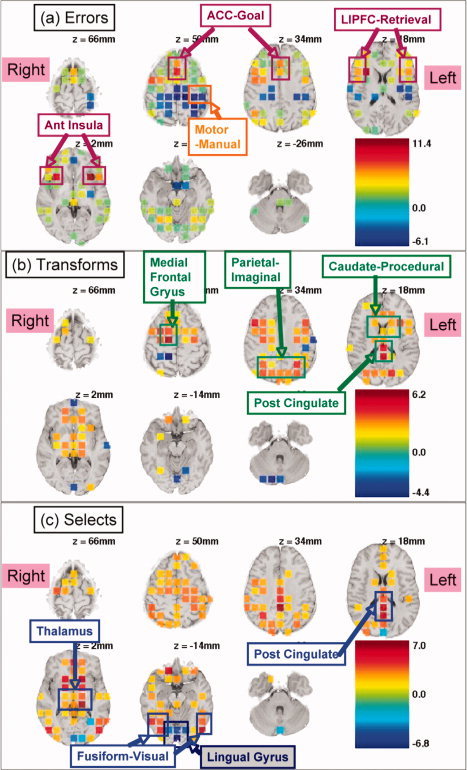
Figure 5.

Regions showing significant effects of error (a), transformation versus evaluation (b), and selection versus execution (c). Refer to Figure 1 for illustration of transformation, evaluation, selection, and execution. Values indicated by color are t values.
