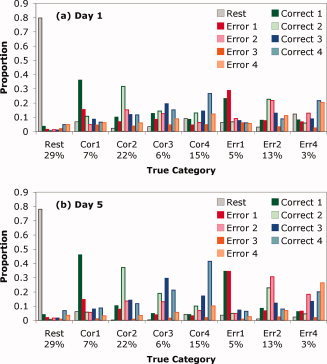
Figure 6.

Ability of the linear discriminant function to distinguish among categories. The x‐axis gives the various categories and proportion of scans from that category. There were not enough observations of errors on step 3 to allow meaningful statistics (less than 0.5% on Day 1 and less than 0.2% on Day 5). The bars for each category show the proportion of scans in each category assigned to each of the nine possible categories.
