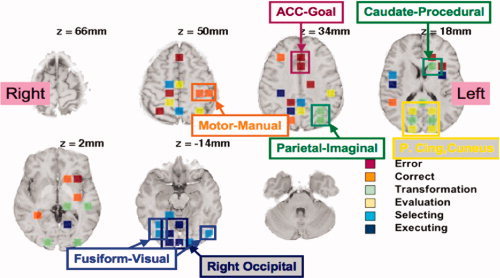
Figure 7.

The 55 highly discriminative regions, labeled with the feature for which they were most active. Highlighted are the regions that are particularly striking and which suggest possible interpretations. They are labeled with their anatomical region and with the name of the ACT‐R module that they have been found to correlate with in past models of algebraic information processing [e.g., Anderson, 2005; Anderson et al., 2008].
