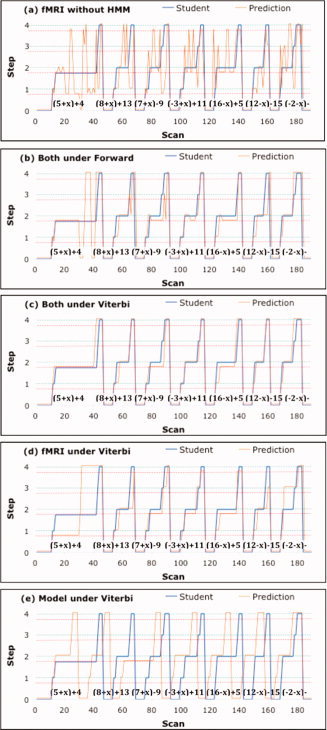
Figure 8.

An example of an experimental block and various attempts to assign scans to stages of problem solving. The x‐axis gives the scan number and the y‐axis displays the progress of the student through seven problems (on Day 1, involving collection of constants—actual problems given in figure) starting in a rest state (0) and stepping through four states. The green dotted line indicates correctly performed steps and the red dotted line indicates incorrectly performed steps. The blue line displays the student's true trajectory and the orange line displays the assigned trajectory. (a) Scans are assigned to the most probable state based on the conditional probabilities from the linear discriminant analysis. (b) The behavioral model and imaging analysis are combined by the Forward HMM algorithm to make the best real‐time assignments. (c) The behavioral and imaging analyses are combined by the Viterbi HMM algorithm to make the best assignments after the block has ended. (d) Only fMRI data are used with the Viterbi Algorithm. (e) Only the behavioral model is used with the Viterbi Algorithm.
