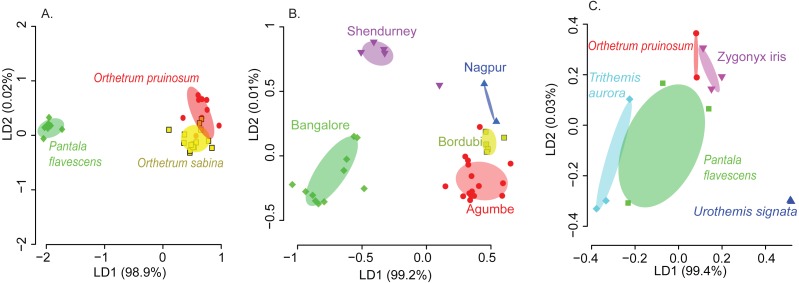
Figure 2. Linear discriminant (LD) plots showing two dominant linear discriminants (LD) that group dragonfly samples based on their gut bacterial community composition (based on Bray-Curtis distance and open reference OTU picking).
Percentage of variance explained by each LD is indicated in parentheses. Each point represents a host individual. Ellipsoids represent 95% confidence intervals around each group mean, calculated from LD values. Clustering of dragonfly samples based on (A) host species identity (3 well-sampled species) (Table S1A), (B) sampling location (for 3 well-sampled species) (Table S1A). (C) Clustering of 5 dragonfly species from Shendurney (Table S1), based on their gut bacterial composition.

