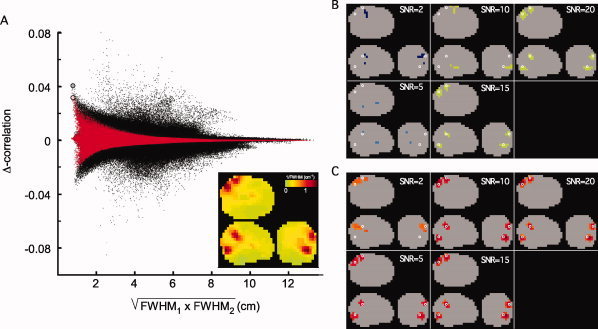
Figure 1.

Example of the effects of nonhomogeneous smoothing on the differential all‐to‐all pairwise source correlations. (A) Scatterplot of differential correlation of all reconstructed dipole pairs as function of the geometric mean of the FWHM at the same locations. Black dots represent the unsmoothed differential correlation values, red dots represent the smoothed correlations. The thick dots represent the estimated differential correlation at the location of the simulated dipole pair, for the unsmoothed (gray) and smoothed case (pink). The inset shows a glass brain projection of 1/FWHM, highlighting the regions of high spatial resolution. (B, C) Glass brain projection of the pairs of voxel clusters closest to the simulated dipole pair (white circles), as a function of SNR, for the unsmoothed (B) and smoothed case (C).
