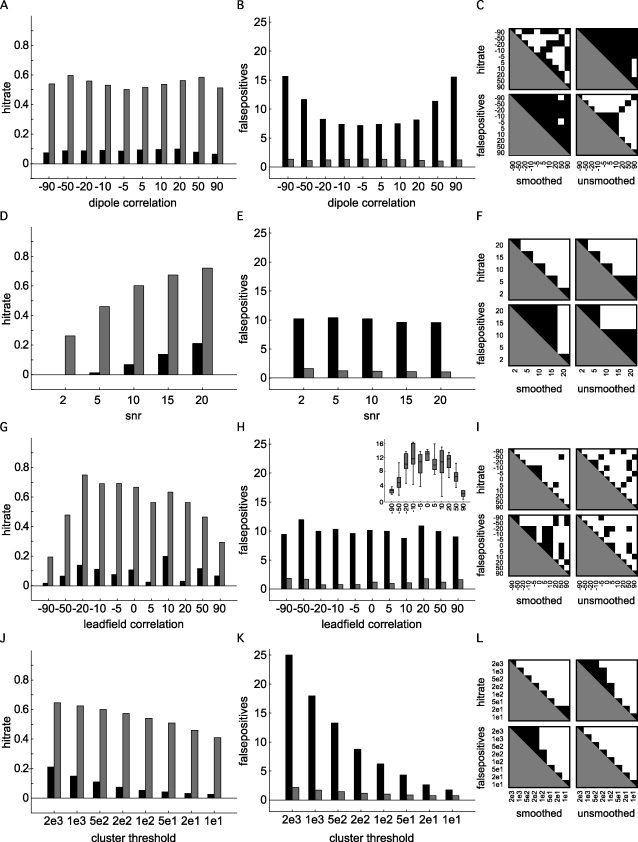
Figure 2.

Results of 5,500 simulations showing the mean hit rate (left column), the average number of false positives (middle column), for the unsmoothed cases (black bars), and the smoothed cases (gray bars). The right column shows the pairwise significant differences for the hitrate and false positives, separately for the smoothed and unsmoothed cases [P < 0.05, corrected for multiple comparisons (Tukey‐Kramer test)]. A–C: Marginal mean hitrate, number of false positives and pairwise significant differences, as a function of simulated dipole correlation. D–F: Marginal mean hitrate, number of false positives and pairwise significant differences, as a function of signal‐to‐noise ratio. G–I: Marginal mean hitrate, number of false positives and pairwise significant differences, as a function of leadfield correlation of the simulated dipoles. The inset in panel H shows the relation between the leadfield correlation and the distance between the target dipoles. J–L: Marginal mean hitrate, number of false positives and pairwise significant differences, as a function of cluster threshold.
