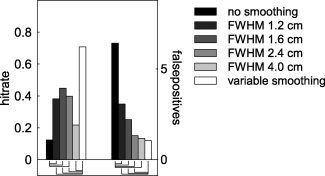
Figure 3.

Comparison of hitrate and number of false positives for unsmoothed and nonhomogeneously smoothed cases, as well as for different homogeneous smoothing schemes. Significant differences between the unsmoothed (black bars) and the homogeneously smoothed, and between the nonhomogeneously smoothed (white bars) and the homogeneously smoothed are shown by the connecting lines underneath the bars.
