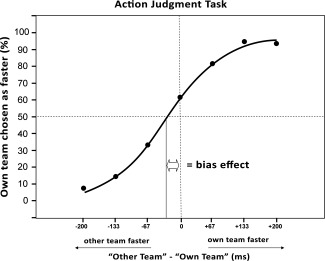
Figure 2.

Perceptual judgments in the action–judgment task plotted as a function of the real time differences between actions in the videos. The data points are fitted by a three‐parameter sigmoid function. Y‐axis: Percentage of trials in which participants judged the action of their own team member as faster than that of the other team member. X‐axis: The real time difference (in ms) between own team and other team actions in the videos, measured from the onset of movement until the hand reached the button.
