
Figure 3.
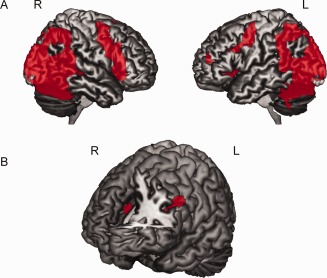
Brain activation results from the fMRI study. A: Action–perception network. Brain activation differences while watching videos of hand actions in the single‐video trials compared with a fixation baseline condition, displayed on a rendered brain in MRIcron (P uncorrected < 0.001, cluster‐size threshold > 25 voxels). B: Brain activation differences in left inferior frontal gyrus and anterior cingulate cortex during explicit judgments on own team versus other team actions in the paired video trials, compared with the press‐left/right (baseline) task, displayed on a rendered brain in MRIcron (P uncorrected < 0.001, cluster‐size threshold > 25 voxels). [Color figure can be viewed in the online issue, which is available at http://wileyonlinelibrary.com.]