
Figure 2.
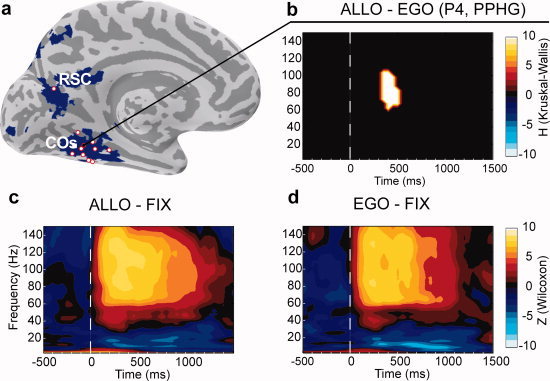
Typical pattern of oscillatory activity recorded from a PPHG site (patient P4, x′5, b–d) and group PPHG sites anatomical location relative to brain areas specialized for allocentric coding as defined from a previous fMRI study (a). (a) Bold contrast Allo > Ego from a previous fMRI study (Committeri et al., 2004) is shown in blue on the inflated MNI brain. Electrode contacts from all patients located at the vicinity of the collateral sulcus or retrosplenial cortex are superimposed (red dots). (b) Typical allocentric statistical effect observed in an individual PPHG (Allo > Ego, Patient 4, KW test FDR corrected) was only observed in the gamma band (50–150 Hz). A positive H value (extracted from KW tests) corresponded to regions in the time‐frequency space where PPHG activity was stronger in the allocentric condition compared to the egocentric condition. (c and d) Time‐frequency representation of the electrophysiological responses recorded in the same PPHG site of Patient 4 (P4) in the Ego (c) and Allo (d) conditions. Warmer (yellow) colors correspond to a significant (Wilcoxon tests) power increase relative to baseline (−800 to 500 ms before stimulus), whereas cooler (blue) colors correspond to power significant power decreases. Wilcoxon tests were not corrected for multiple comparisons with FDR for illustrative purposes. [Color figure can be viewed in the online issue, which is available at wileyonlinelibrary.com.]