
Figure 2.
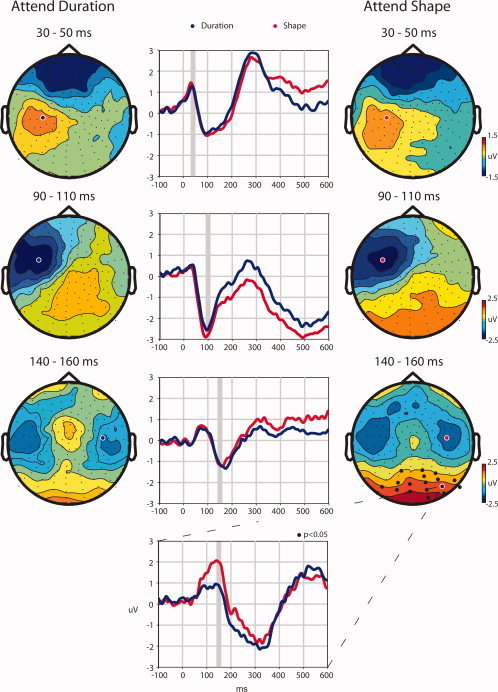
Spatiotemporal evolution of somatosensory evoked potential. The left column shows the topographical distributions of the Duration condition and the right column the Shape condition for three time windows, 30–50 ms, 90–110 ms, and 140–160 ms, one for each row. The center column shows the evoked potential for channels selected to illustrate the focus of activity for each timeframe. The Duration condition is represented by blue lines and the Shape condition is represented by red. Similarly, channels selected for display are indicated on the topographical maps by blue circles with white borders for the Duration condition and red circles with white borders for the Shape condition. The bottom waveform illustrates the greater response over posterior scalp observed for the Shape condition during the 140–160‐ms timeframe at a channel where significant differences were found, which is indicated by a white border around a black dot on the topographical map for the Shape condition during the 140–160‐ms timeframe. Gray boxes indicate the time interval represented in the corresponding topographical maps. The black circles on the topographical maps mark the position of the channels that were found to be significantly different between conditions (P < 0.05) after a multiple comparisons correction.