
Figure 2.
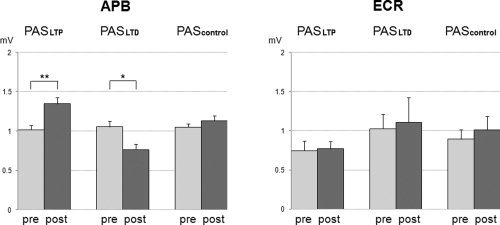
MEP amplitudes (in mV) pre‐PAS (light gray columns) vs. post‐PAS (dark gray columns, mean ± S.E.M) in the APB (left diagram) and ECR (right diagram). MEP amplitudes in the APB increased after PASLTP and decreased after PASLTD (*P < 0.05; **P < 0.01) while there were no changes in MEP amplitude in the ECR.