
Figure 2.
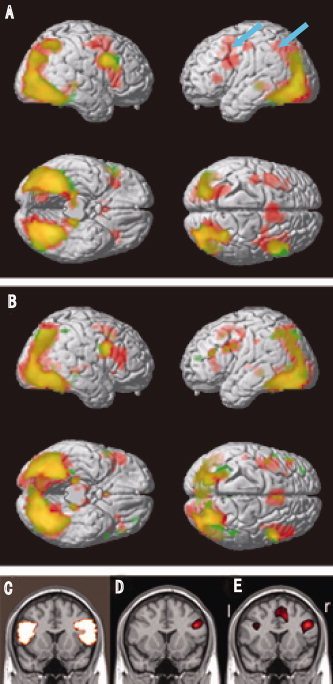
Activated brain regions during (A) the designing task and (B) the counting task (control). Red areas indicate activation in the novice group, and green areas indicate activation in the expert group. Yellow areas were activated in both groups. Blue arrows indicate the left PFC and PC region. (C) A frontal section in which ROI of the inferior frontal gyrus pars triangularis of the prefrontal cortex (PFC) was outlined. (D) and (E) Active regions with the design task are shown in red for the (D) expert and (E) novice groups, respectively. The “l” and “r” in (E) indicate the left and right sides, respectively.