
Figure 4.
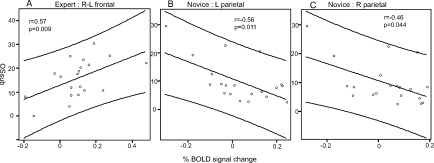
Correlations between individual originality scores (OSsub) and BOLD signal changes in the regions indicated. (A) A correlation in the right PFC—left PFC in expert subjects. (B) and (C) Correlations in the left PC and right PC in novice subjects, respectively. The axis indicates OSsub or productivity, and the abscissa indicates the % BOLD signal change. The “r” indicates the correlation coefficient with P‐value.