
Figure 3.
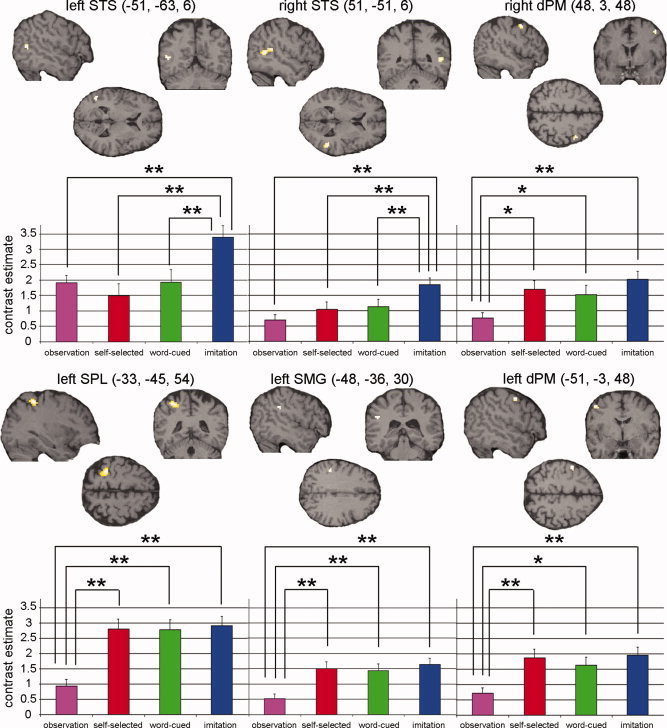
Comparisons between conditions in each of the regions identified in the conjunction analysis. Coronal, axial, and sagittal sections displayed at an uncorrected threshold of P < 0.001 + contrast estimate and S.E. of the most significant voxel in that cluster. Significant differences (*P ≤ 0.01, **P ≤ 0.001, see Table I) between the conditions are shown. STS, superior temporal sulcus; SPL, superior parietal lobule; SMG, supramarginal gyrus; dPM, dorsal premotor cortex.