
Figure 1.
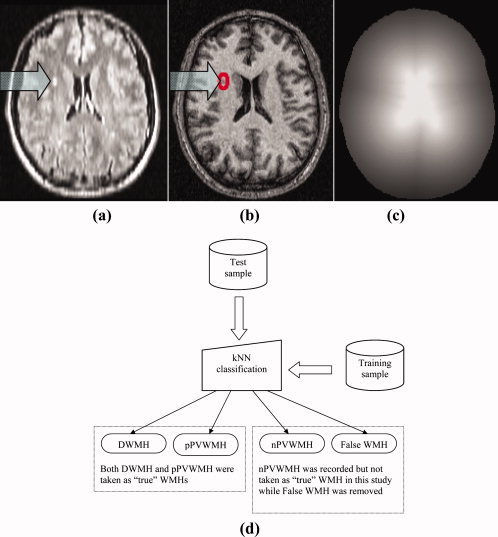
Preparation for kNN classification feature space: (a) A candidate WMH cluster is extracted from FLAIR image. The ratio of the mean intensity of this candidate WMH cluster over the intensity of brain tissue is then calculated. (b) The voxels that surround this candidate WMH cluster form a 3D “shell” around the cluster, and from the co‐registered T1‐weighted image the “shell” is extracted and its intensity information is calculated. WMH cluster size (number of voxels in the cluster) is also calculated. (c) The spatial information of this candidate WMH cluster with respect to the nearest edge of the lateral ventricles is obtained from this “ventricle distance map”. The voxel intensity of this ventricle distance map is the distance of that voxel to the nearest edge of the lateral ventricles. (d) Flowchart of kNN classification implementation. implementation. [Color figure can be viewed in the online issue, which is available at www.interscience.wiley.com.]