
Figure 4.
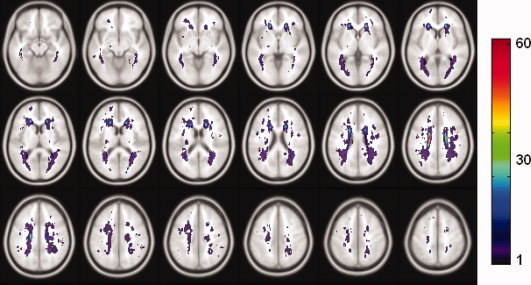
Spatial distribution of WMHs. Map of the sample (n = 218) with WMHs in the standard space. The WMHs were mapped into the standard space from their each individual acquisition space. The color bar denotes the number of WMH occurrences of the anatomical location. [Color figure can be viewed in the online issue, which is available at www.interscience.wiley.com.]