
Figure 1.
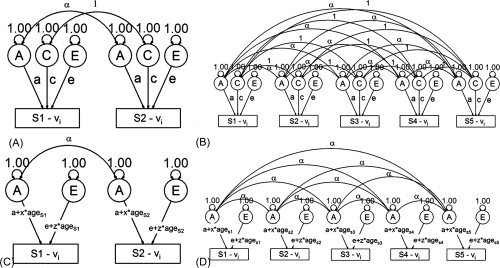
Path diagram of genetic models. Panels A and C depict the classical ACE twin model and an AE twin age‐moderated model, respectively, while panels B and D depict the extensions to these models used in the present study to accommodate between zero and three additional subjects per family. Panels A and B: Latent factors A, C, and E are allowed to influence the observed causal paths a, c, and e, with latent shared environmental factors correlated at unity, but additive genetic correlations correlated 1 or [1/2] depending on familial relationship. Panels C and D: In the moderated model, parameter estimates are allowed to vary based on individual subject ages. For both models, age and sex regressions on mean CT are not shown for the sake of simplicity, though these parameters were estimated simultaneously with the variance components. S = Subject number (1–5), vi = CT for the ith vertex.