
Figure 3.
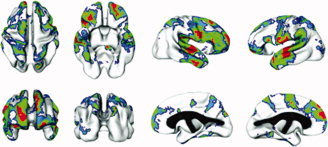
Regions of significant heritability. Voxels are color‐coded for level of significance following application of FDR threshold. Red voxels are significant at P ≤ 0.05; green = 0.05–0.10; blue = 0.10–0.15 (corresponding to uncorrected P values of 0.002, 0.016, and 0.042, respectively).