Figure 1.

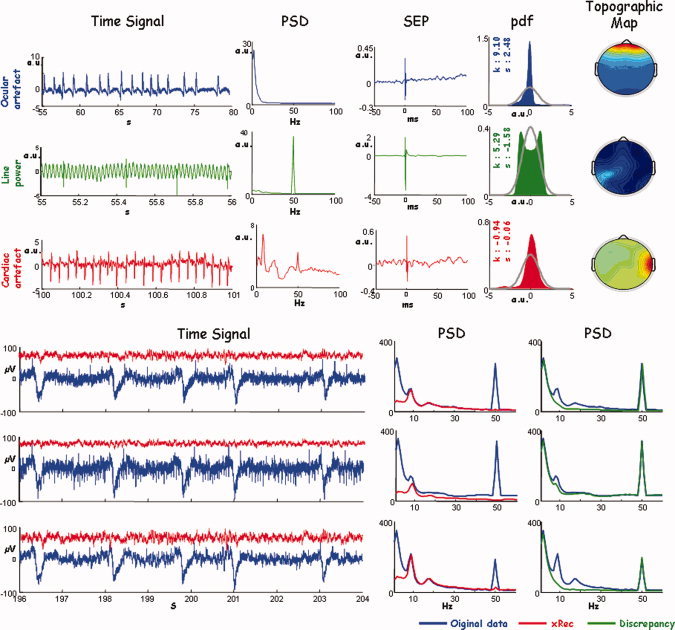
Artefact identification. Up: First column, time evolution (Time Signal) of the ICs identified as follows: ocular artifact, first row; line power, second row; and cardiac artifact, third row. Time scale is chosen appropriately for each ICs. From second column, for each ICs: the power spectral density (PSD); the average in phase to the median nerve stimulation at wrist (SEP); the probability density function to describe the distribution probability (pdf), the grey line indicates the normal probability density, the values of kurtosis (k), and skewness (s) are provided; spatial distribution obtained by representing the corresponding IC weights (Topographic Map). As ICA procedure performs whitened preprocessing, each quantity is expressed in arbitrary unit (a.u.). Bottom: An exemplificative time segment on three EEG channels, contaminated by different artefacts with different weights. Original signal and PSD (blue), the signals reconstructed by removing all ICs corresponding to different artefacts and its PSD (red); in green the PSD of the signal obtained as retro‐projection of only artifactual ICs. [Color figure can be viewed in the online issue, which is available at www.interscience.wiley.com.]
