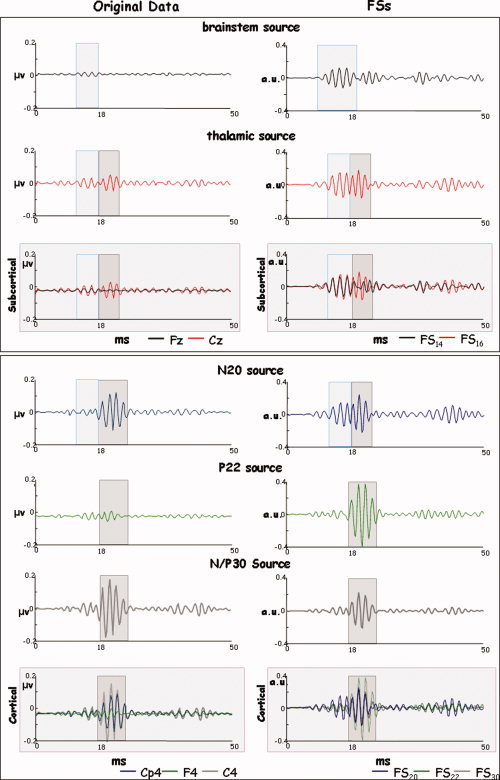
Figure 6.

High‐frequency source behavior. For a representative subject, the HFO time course of stimulus‐locked average of the five studied sources as characterized by the original EEG data (the maximum channel for each latency peak, left column) and FSs (right column) in the 0–50 ms time window following the stimulus onset. Panels differentiated subcortical (up) and cortical (bottom) components. FS time‐series is of higher amplitudes then original data especially for the brainstem and thalamic sources and has a more favorable signal‐to‐noise ratio. In both the original channels and the FSs, the subcortical components (light blue box) are activated before the cortical ones (grey box) and the thalamic component is still active in correspondence to the N20 source activation. Appreciable in the FS20 and not in the original representative channel, a HFO burst preceding the cortical activation. [Color figure can be viewed in the online issue, which is available at www.interscience.wiley.com.]
