
Figure 1.
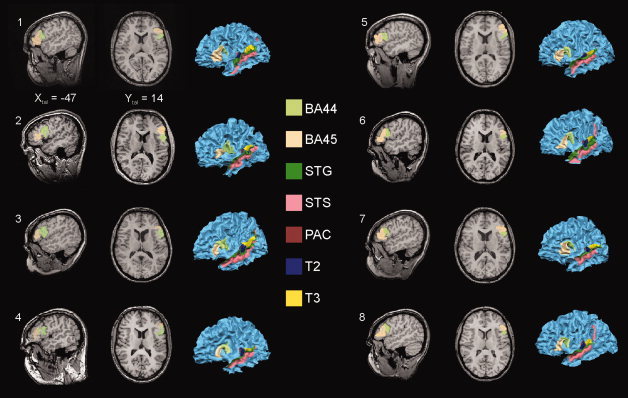
Illustration of left hemispheric individual ROIs. Depicted are one sagittal and one horizontal slice of each participant's brain and a three‐dimensional reconstruction of the white/gray matter border of the left hemisphere. For each individual participant Brodmann areas 44 and 45 (BA44; BA45) of Broca's region are shown in the slices and projected on the 3‐D structural data. In addition all other left hemispheric ROIs are shown on the surface representation. We defined the individual ROIs using the reconstructed image of the hemisphere by tracing the ROI borders on the individual surface with continuous checking the position on the individual structural 3D volume. This kind of ROI definition is more reliable and comfortable than the use of only the 3D volume data, because the simultaneous view on the reconstructed brain allows a better identification of macroanatomical landmarks like specific gyri or sulci. Each point of the surface is co‐registered with a specific voxel of the 3‐D volume. Xtal Talairach coordinate X, Y tal Talairach coordinate Y, color‐coded are the specific ROIs. See text for more details of ROI definition.