
Figure 7.
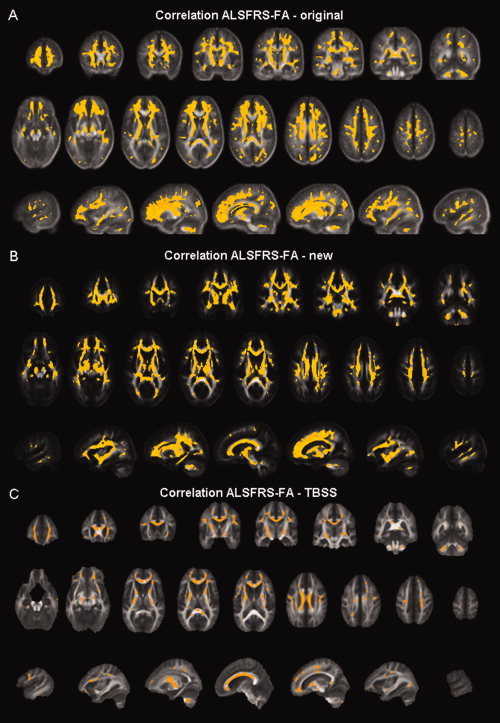
Regions showing significant positive correlation between FA values and the patients' scores on the ALS functional rating scale are shown in yellow on coronal/axial/sagittal slices of the mean FA map for the old voxel‐based analysis (A), of the FA map of the DTI atlas for the new voxel‐based analysis (B), and of the mean FA map of the tract‐based spatial statistics analysis (C). Note that the results of the TBSS analysis have been enhanced for visualization purposes. In all analyses, this correlation was present throughout the WM.