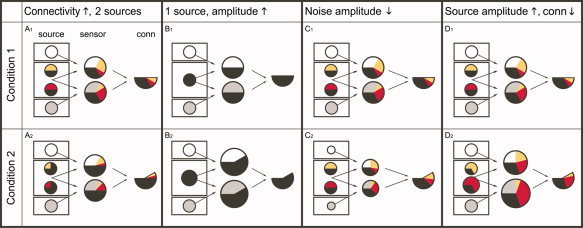
Figure 2.

An estimated increase in connectivity may have different causes. The left column in each panel represents the sources, which are arranged in three compartments. Each circle represents a source, and these comprise the actual neural sources in the central “brain” compartment, and the irrelevant noise sources in the upper and lower compartments. The neural sources share a common component (a degree of connectivity), which is depicted as the black part of the circles. The circles in the middle column represent two sensor signals. Each of the sensors picks up a different mixture of the underlying sources. The partitioning of the sensor signals represents the relative contributions of the respective sources. The size of the circles represents the amplitude of the signal picked up at these sensors. The right column in each panel represents in the total area of the partitioned circle the degree of connectivity estimated between the two sensor signals. This degree of connectivity results from the total area of overlap between the colored partitions in the sensor signals. (A1, A2) Modulation of estimated connectivity due to a change in connectivity between neuronal sources of interest. The scenario A1 shows 4 sources (four circles in leftmost column). The different colors represent different uncorrelated signal components. The time series of the two sources in the middle contain a common component that makes up a specific part of their individual signal. Both sources are picked up by two sensors (circles in the middle column). Because of the noise sources only part of the sensor signals consists of signals of neural origin. This part is further subdivided into the different relative contributions of the two sources. Because of the fact that the upper sensor is closer to the upper source than to the lower source, it “sees” more of the upper source. Therefore, the yellow partition in the upper sensor is bigger than the red partition. The black part of the sensor signals represents the common component projected from the sources and has in fact been “diluted” by the noise sources. The degree of connectivity is derived by assessing the total overlap of colored partitions between the two sensors. Thus, it consists of the true common component picked up by the sensors (in black) and of the overlap in the colored partitions. In scenario A2, the common component in the activity of the neural sources is increased. Despite the diluting effect of the noise sources, an increase in the degree of connectivity can still be detected. (B1, B2) Modulation of estimated connectivity due to an increase in amplitude of a single neuronal source. (C1, C2) Modulation of estimated connectivity due to a decrease in amplitude of noise sources. (D1, D2) Modulation of estimated connectivity due to an increase in amplitude of the neuronal sources of interest, with a concurrent decrease of connectivity between them.
