
Figure 5.
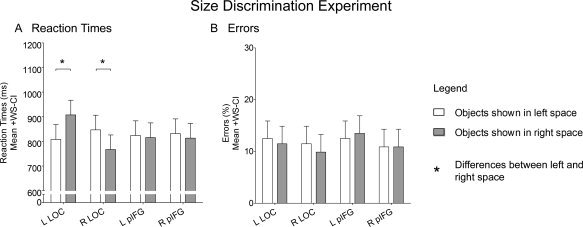
Size Discrimination experiment. The graphs plot mean reaction times (A) and errors (B) while participants responded with button pressing as to whether the physical size of the stimuli as shown on the computer screen were “small” or “big” for objects presented in either left (white) or right (gray) space when TMS was applied over the left LOC, the right LOC, the left pIFG, or the right pIFG. Asterisks (*) denote differences between objects in left versus right space. Error bars represent 95% confidence intervals for within‐subject contrasts [Loftus and Masson,1994].