
Figure 6.
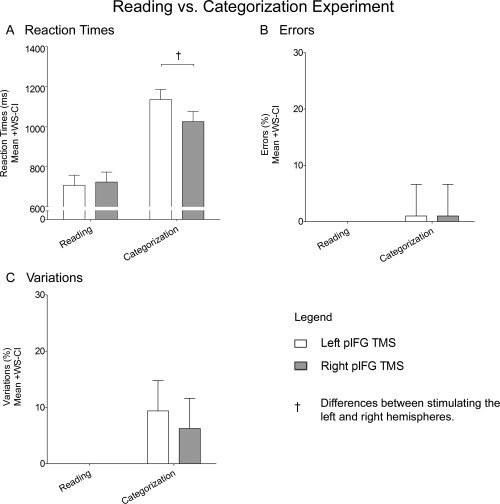
Reading vs. Categorization experiment. The graphs plot mean reaction times (A), errors (B), and variations (C) for reading and categorizing words when TMS was applied over the left pIFG (white) or the right pIFG (gray), Daggers (†) denote differences when TMS was applied to the left compared to the right hemisphere. Error bars represent 95% confidence intervals for within‐subject contrasts [Loftus and Masson,1994].