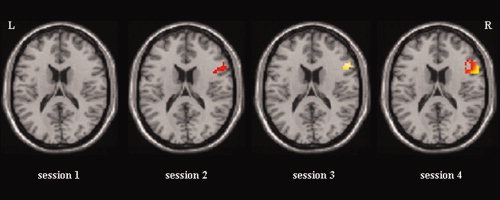
Figure 3.

Cortical activation maps of the learning effect obtained by the experimental group across training sessions. Statistical parametric maps are based on a random effects analysis, N = 7, P < 0.05 (uncorrected for visualization). ROI target activation maps are displayed on a single subject T1 template (MNI coordinate z = 18) using a spatial mask (mask = right BA 45) constructed with the WFU‐PickAltas (Maldjian et al., 2004, 2003) implemented in SPM2. [Color figure can be viewed in the online issue, which is available at www.interscience.wiley.com.]
