
Figure 4.
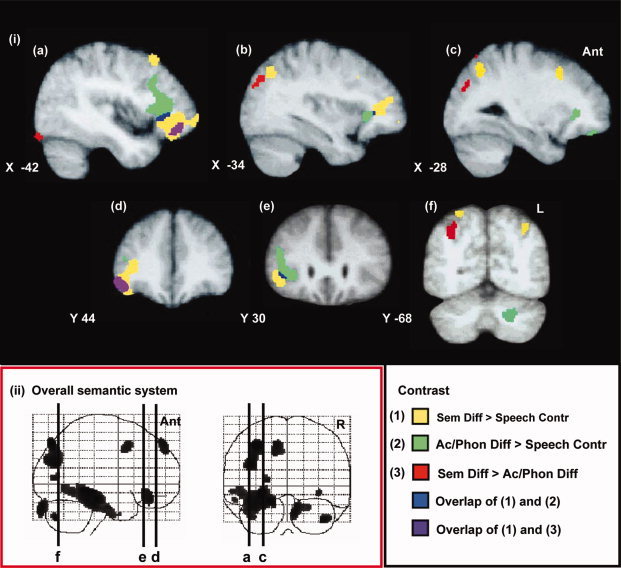
The effects of varying semantic and acoustic/phonological difficulty. (i) (1) High semantic difficulty versus the control speech condition in yellow (Sem Diff > Speech Contr). (2) High acoustic/phonological difficulty versus the control speech condition in green (Ac/Phon Diff > Speech Contr). (3) High semantic versus high acoustic/phonological difficulty conditions in red (Sem Diff > Ac/Phon Diff). The overlap of (1) and (2) displayed in blue and of (1) and (3) in purple. Contrasts are rendered onto sagittal (a–c) and coronal (d–f) slices from the group MRI template. (ii) A display of the statistical parametric map showing sagittal and coronal projections of the overall contrast of semantic processing with the nonlexical baseline. (a–f) represent the locations of sagittal and coronal slices shown in (i). Thresholding and labeling as in Figure 3.