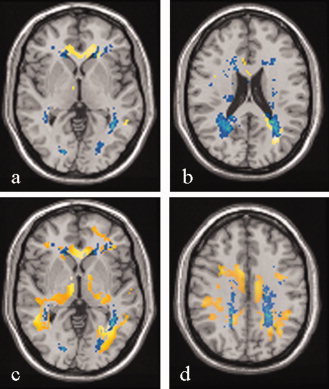
Figure 3.

Two representative axial slices showing lesion probability maps (in yellow) and areas with significant decreased fractional anisotropy (FA) (SPMt map in blue) for primary progressive multiple sclerosis (PPMS) (A and B). The overlap between lesion probability maps and areas with significant decreased FA are in light green. Two representative axial slices showing lesion probability maps (in yellow) and areas with significant increased mean diffusivity (MD) (SPMt map in blue) for PPMS (C and D). The overlap between lesion probability maps and areas with significant increased MD are in light green. Images are in neurological convention. See text for further details.
