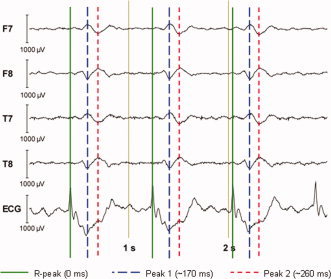
Figure 4.

A representative 3‐s EEG trace displaying the BCG artefact measured on a 3 T Philips Achieva MRI scanner (with B 0 field pointing from head to foot) and the timing relationship between the R‐peaks of the ECG and the two subsequent peaks in the individual EEG traces for which the spatial maps displayed in Figure 5. [Color figure can be viewed in the online issue, which is available at www.interscience.wiley.com.]
